Key Metrics for Running and Selling a SaaS Business
- Which metrics you need to track in order to run and sell your SaaS business
- How to correctly calculate SaaS metrics in a way investors/buyers will prefer
If a buyer interested in your business were to ask you what your retention rate is and what you expect your gross margin to be next year, would you know how to respond?
Many founders don’t.
Before the time comes to sell your business, you need to make sure you’re tracking appropriate key metrics so you don’t draw a blank in front of potential buyers or investors.
Myth: Profitability and a good product are enough
A common belief among SaaS founders is that a superior product or impressive profitability are enough to entice buyers/investors (referred to as "buyers" for the remainder of this article) to cut a deal. This false belief that good companies are bought not sold tends to lead founders to neglect tracking the metrics critical for running and later on selling their SaaS business.
Beyond the day-to-day importance of monitoring business performance, if you don’t track your business’ key metrics, you won’t be prepared to provide the answers buyers need to determine the real value of your business.
Even if you think everything is going just fine, we’ve found that companies who don’t actively track metrics often have underlying challenges that a buyer could expose with a basic, cursory analysis.
On the other end of the spectrum, some founders become so hyper-focused on tracking every little thing that they forget the big picture metrics and overall direction of the company. The best approach is to focus on the core metrics in which buyers will be interested.
Make sure you’re talking about the same metrics
Many of the metrics buyers are concerned about could be calculated in different ways. Founders and buyers need to make sure to align along the same calculations, so that later on buyers aren't surprised by the data a founder (or his/her banker) provides.
For example, two interpretations of revenue for valuation (one calculated with total cash bookings and the other with GAAP revenue) could lead to an uncomfortable conversation between buyers and founders about the value of a business.
Below are the top metrics (with standard calculation methodologies) to help you effectively frame your business to interested parties in the most accurate way possible.
Note: All metrics assume GAAP-basis financials
1. YoY Revenue Growth Rate
Year-over-year (YoY) revenue growth rate is a calculation of how quickly net revenue (gross revenue less returns, allowances, and discounts) is growing year to year. Net revenue is used instead of gross revenue to only account for revenue properly allocated to the business’ performance.
Formula for YoY Revenue Growth Rate:
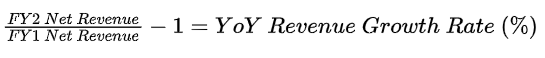
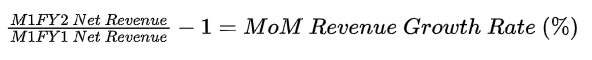
The above formula compares growth across an entire year. You can also compare individual months with a similar formula.
Formula for MoM Revenue Growth Rate:
Implications of YoY Revenue Growth Rate
Buyers use YoY revenue growth rates as an important factor in determining a valuation multiple for potential portfolio companies. We generally classify SaaS businesses under three buckets of growth and corresponding valuation multiples:
Note that these ranges assume a level of revenue between $5M and $50m.
Lower Growth SaaS: 0-20% growth
Businesses in this category are usually one or more of the following:
- Mature
- Lacking a strong outbound sales & marketing effort
- Run purely for profitability (considered a "lifestyle" business)
- Have little outside funding or aggressive investors looking for a strong return on invested capital
Lower growth SaaS businesses tend to sell within the range of 1 to 5 times last twelve months (LTM) revenue.
Strong Growth SaaS: 20-55% growth
Businesses operating within this range of growth usually require at least one of the following:
- An industry-defining product
- A massive target market
- An intense focus on investment in sales & marketing.
Strong growth SaaS businesses are usually valued in the range of 3 to 10 times LTM revenue.
Best-in-Class, Rapid Growth SaaS: 55%+ growth
As you might expect, best-in-class businesses in this range usually serve both a massive target market ripe for technological disruption and have a strong focus on efficient sales & marketing spending. These businesses are often sold between 5 and 15+ times LTM revenue.
Considerations
When evaluating their businesses, founders often think on a month-to-month basis. You technically can also calculate a month-over-month (MoM) growth rate, which can be helpful for buyers when evaluating a hyper-growth (100%+ YoY growth) company. However, buyers usually consider YoY metrics as the gold standard.
If you do quote a MoM rate, make sure to be clear that’s the metric you’re using.
2. Gross Margin (%)
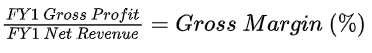
Gross margin indicates what percent of every dollar earned as net revenue you get to keep after subtracting the direct costs required to deliver that revenue. This margin is calculated as gross profit (gross revenue less cost of goods sold) divided by net revenue.
Formula for Gross Margin:
Implications of Gross Margin
Managers and buyers use gross margin to determine the profitability of each dollar of incremental revenue, as well as the percentage cost to directly service the customer base. SaaS companies tend to have high gross margins, which is one reason these businesses are so attractive to buyers.
Considerations
While gross margin may seem simple to calculate using your firm’s internal financial software, you need to take care to monitor what is and isn’t included in COGS. Some expenses that you might consider as operational expenses (such as personnel costs) should be included under COGS.
If you don’t include all appropriate expenses within COGS, you could be overestimating your gross margin, which can reflect poorly on your company when buyers re-classify expenses during diligence.
For the typical SaaS business, we encourage clients to include the following items within COGS:
- Web hosting costs
- Portion of Customer Success Manager time dedicated to new client onboarding (NOT upselling)
- Platform troubleshooting and break-fix personnel (DevOps, SysAdmin, Product Support, etc.) and related software costs
- DDoS, WAF, cybersecurity, log/threat monitoring, and other related technology costs
- Merchant payment processing costs (costs to process customer credit cards—generally ~2%)
- One-time implementation and data migration costs and the related personnel costs
Including these expenses in COGS will give a more accurate view of margins on your software products.
We also encourage clients to break out gross margin by each type of revenue, including
- Core software
- Add-on products
- One-time/transactional
- Customer type (if SMB and Enterprise customers have separate platforms and/or CSM coverage)
Breaking out these metrics will give buyers a better view of which types of revenue yield the best margins and contribute/detract from overall margins.
3. Bookings, ARR, and Recognized Revenue
Bookings, ARR, and Recognized (GAAP) Revenue are different lenses for evaluating a company’s ability to generate income from customers. While these metrics may seem relatively straightforward and even similar, using the correct calculation framework is key for analyzing trends and forecasting revenue performance.
Bookings
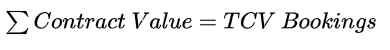
Bookings is a basic sum of contract value. The most common ways to calculate bookings are as total contract value or TCV (the sum value of all contracts) and as annual contract value or ACV (the value of all contracts to be earned in an annual period).
Formula for TCV Bookings:
Formula for ACV Bookings:
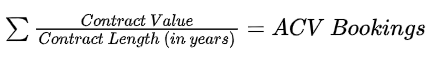
As an example, if a customer books a 3-year contract worth $1,200 per year, the TCV would be $3,600. The ACV would be $1,200, as you would only count ⅓ of the contract.
A related metric is Annual Booked TCV, which is the sum of total contract value for bookings in a given year. This metric can help businesses and buyers view sales & marketing performance from year to year.
TCV and ACV bookings take into account the full value of all contracts, including non-recurring fees like training and implementation. To get an understanding of how much of that revenue is recurring, buyers frequently use ARR.
ARR
ARR or annualized recurring revenue is the sum of all contract line items that can be considered recurring revenue. In a SaaS business, recurring revenue corresponds to subscription fees.
Formula for Annualized Recurring Revenue:
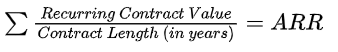
For companies that charge a monthly subscription for the same amount, they will often instead calculate monthly recurring revenue (MRR) and multiply that by 12 to get ARR.
Recognized Revenue
While ACV bookings and ARR give you an idea of how much revenue you’ve signed on in a given year and expect to earn, recognized revenue (or GAAP revenue) represents how much money can be attributed to a given period.
For example, if a one-year, $1,200 contract begins on 8/1/2019 and concludes on 7/31/2020, only 5 of the 12 months of that contract will be earned in 2019, so only 5/12 of $1,200, or $500, will be allocated to 2019 as recognized revenue, even if the contract was paid in full in 2019.
Formula for Recognized (GAAP) Revenue:

Implications of Bookings, ARR, and Recognized Revenue
Each of these measures of revenue provide different insight into a company’s ability to earn revenue.
Bookings indicates how well a company can sign on new clients and extend subscription contract lengths, and is primarily a measure of a company’s sales & marketing efforts.
ARR (in connection with retention) indicates how scalable a SaaS company’s business model is. For example, if a company has high bookings but the majority of revenue is non-recurring, resulting in lower ARR, the business will not be as valuable to buyers. On the other hand, a decent amount of bookings with the majority as recurring revenue and a high retention rate sends positive signals to buyers.
Recognized revenue is purely a mathematical function based on TCV. It indicates how much revenue the company earns in a given period.
4. Net Revenue Retention (NRR) Rate
Net revenue retention rate (NRR) is derived for a specific cohort of customers to determine what percent of the initial contracted recurring revenue (ARR) the company retains for that cohort after a year. In other words, NRR demonstrates how much ARR you can expect a year later for the same cohort of customers.
Formula for Net Revenue Retention Rate:
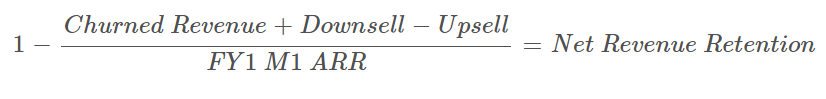
Note: Churned Revenue, Downsell, and Upsell are all in period FY2 M1
This metric incorporates increases and decreases in recurring revenue due to:
- Customers leaving the platform (churn)
- Customers spending less on the platform (downsell)
- Customers spending more on the platform (upsell)
Note that this metric does not include revenue generated through new customers added during the time period, nor does it include one-time/transactional revenue generated by the customer cohort of interest—only recurring revenue.
Since NRR includes upsell, technically the percent can be above 100%, in which case a cohort’s upsell amount is greater than the loss due to churn and downsell.
For example, if your business’ historical NRR is consistently 105% and December 2019 ARR is $10M, one would expect this cohort of customers to represent $10.5M of ARR in December 2020 and $11.025M of ARR in December 2021.
Implications of Net Revenue Retention Rate
What determines a strong, satisfactory, or poor NRR depends on many factors, including:
- Sales model (high vs. low touch)
- Pricing (per-user vs. fixed)
- Customer type (SMB vs. enterprise)
- Contract terms (multi-year upfront vs. uncontracted/monthly)
For example, a business serving enterprise customers with a per-seat pricing plan, $1M+ average contract values, and 3-year prepaid contracts should experience much higher net retention rates than a business serving tens of thousands of SMBs on a monthly basis with a zero-touch sales model.
That being said, in general, a rate over 100% is considered very strong, whereas a rate under 85 - 90% can demonstrate weakness in upsell potential and/or high customer churn rates.
5. Gross Revenue Retention (GRR) Rate
Similar to NRR, gross revenue retention rate (GRR) helps you see how much revenue you can expect to retain from a given customer cohort. The difference between GRR and NRR is that GRR does not incorporate upsell, and therefore cannot exceed 100%. When placed alongside NRR, GRR helps business managers and buyers identify how much the business relies on upsell to retain revenue from existing customers.
Formula for Gross Revenue Retention Rate:

Note: The two ARR metrics above represent the ARR for the specific customer cohort in month M1 of FY1.
Implications of Gross Revenue Retention Rate
Many buyers use 80% GRR as a rough cut-off to differentiate great, low-risk investment opportunities from not-as-great ones. A lower GRR frequently signifies a higher risk business that must depend on new customer additions instead of retaining existing customers in order to reach bookings and revenue growth goals.
6. Logo (Customer) Retention Rate
Logo retention rate represents what percentage of your firm’s customers remain after one year. Similar to revenue retention, logo retention looks at cohorts, usually broken down by month. In this case, you would calculate how many total active customers (usually this means customers with revenue) there are in a given month and then see how many among that group were still active a year later.
Formula for Logo Retention Rate:
![]()
Note: Churned Customers from above refers to the number of active customers from the FY1 Month 1 cohort who churned between FY1 M1 and FY2 M1.
Implications of Logo Retention Rate
Similar to other metrics, a good vs. not-so-good logo retention rate depends on many factors in your business. Here are some scenarios for a SaaS business and what management should aim for or a buyer would like to see in terms of logo retention.
- Generally, a software business targeting enterprise customers should see at least 90% logo retention to be considered best-in-class.
- A software business targeting SMBs that allows even the smallest customers to subscribe to its platform (such as through low entry-pricing options) should see at least 75-80% logo retention across the entire customer base to be considered best-in-class.
SMB software businesses may want to stratify their customer base to show that the top 25-40% of customers exhibit over ~80% logo retention.
7. EBITDA
Notwithstanding how this metric may be pronounced, EBITDA is a simple proxy used to calculate your firm’s cash flow.
Formula for EBITDA:

Implications of EBITDA
While net income is the true measure of profitability, EBITDA, or earnings before interest, taxes, depreciation, and amortization, adjusts net income to remove expenses outside a company’s control and non-cash expenses from the equation. The goal of EBITDA is to get a better view of operational profitability before creditors and government entities take their piece.
Considerations
If your business is a pass-through entity (LLC, S-corp, etc.) with no debt or depreciable assets (meaning all asset purchases are expensed as incurred), your net income may be equal to your EBITDA.
In order to gain a more accurate picture of "business as usual," founders and their advisors may elect to adjust EBITDA for one-off or non-business related items.
Below is a list of EBITDA add-backs we see most frequently:
- Above-market excess compensation paid to shareholding management
- One-time legal bills and litigation expenses
- Board member fees and expenses (if board members do not expect to remain after the sale of the business)
- Severance/restructuring and one-time benefits paid to employees
- Stock-based compensation
- Merger integration expenses
- Shareholder personal expenses, including boats, cars, houses, planes, memberships, charities, travel, etc.
- Any other one-time expenses not incurred in the ordinary course of business
8. Growth-Plus-Margin (%)
Buyers want to judge how effectively your company balances a growth-at-all-costs mentality with efficient investment. The goal of the growth-plus-margin metric is to determine if a company is correctly balanced between growth and profitability.
Formula for Growth-Plus-Margin:

Note: Adj. EBITDA margin is equal to Adj. EBITDA / Revenue.
Implications of Growth-Plus-Margin
When looking at this metric, buyers use the Rule of 40, in which they consider a 40% growth-plus-margin as a reasonable threshold for measuring a successful business. So if one company had 20% growth and 20% profitability and another 50% growth and (10%) profitability, each would pass the Rule of 40 test.
Of course, two companies with the same growth-plus-margin aren’t on equal footing. Based on regression analyses of our past client outcomes (50+) and publicly traded SaaS businesses, buyers tend to value growth slightly more than profitability.
If a founder is debating over whether to strategically target revenue growth and EBITDA margin on a 20%/20% vs. 30%/10% split, we would advise the 30%/10% due to a slight current market preference for growth.
9. Customer Lifetime Value, Customer Acquisition Cost, and LTV:CAC Ratio
Customer lifetime value (LTV) and customer acquisition cost (CAC) answer the questions:
- How much gross profit can I expect a new customer to bring in across their entire lifetime?
- How much am I spending to acquire each incremental customer?
- Am I earning a substantial multiple of spending (second bullet) in gross profit (first bullet)?
Formula for LTV:

Note: Avg. Customer Lifespan can be calculated as follows:
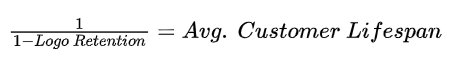
Note that the above calculation multiplies ARR by gross margin, so LTV is a representation of gross profit (not revenue) generated by each customer across their lifetime.
Formula for CAC:

When taken together as a ratio of LTV:CAC, these metrics help identify how efficiently a company adds new customers.
The above formulas might appear difficult to digest, but the output is relatively intuitive. As an example, assuming a business has the following characteristics:
- The average customer stays on the platform for 2 years
- The business earns $1,000 of run-rate (i.e. per year) gross margin per customer
- The business spent $500 in sales and marketing costs per new customer added to the platform in that period
In this case, the company would have:
- LTV of $1,000/year x 2 years = $2,000
- CAC of $500
- LTV:CAC of 4:1
With a LTV:CAC ratio of 4:1, the above business effectively earns $4 (gross profit) for every $1 invested in sales & marketing.
Implications of the LTV:CAC Ratio
Business managers and buyers use the LTV:CAC ratio to determine how efficiently the company generates value through sales & marketing.
If the LTV:CAC ratio for a company is too low (close to 1:1), the company is spending too much on sales & marketing and is breaking even in terms of operating profit (and probably taking a loss overall).
If the LTV:CAC ratio for a company is too high (close to 5:1), then the company isn’t spending enough on sales & marketing and is probably missing out on business.
Track These Metrics Early to Allow for an Outsized Exit
These are a sample of the key metrics Vista Point uses when advising SaaS clients regarding valuation expectations, business highlights, key positioning, and areas for improvement. Together, these metrics form a robust view of the health of a business—both for management as well as potential investors and buyers.
Setting up your systems to track each of these metrics may take some time up front, or require expensive software such as SaaSOptics, BareMetrics, Recurly, or Zuora. The earlier you implement them as an owner, however, the better you will understand your business, and the more valuable your business will be.